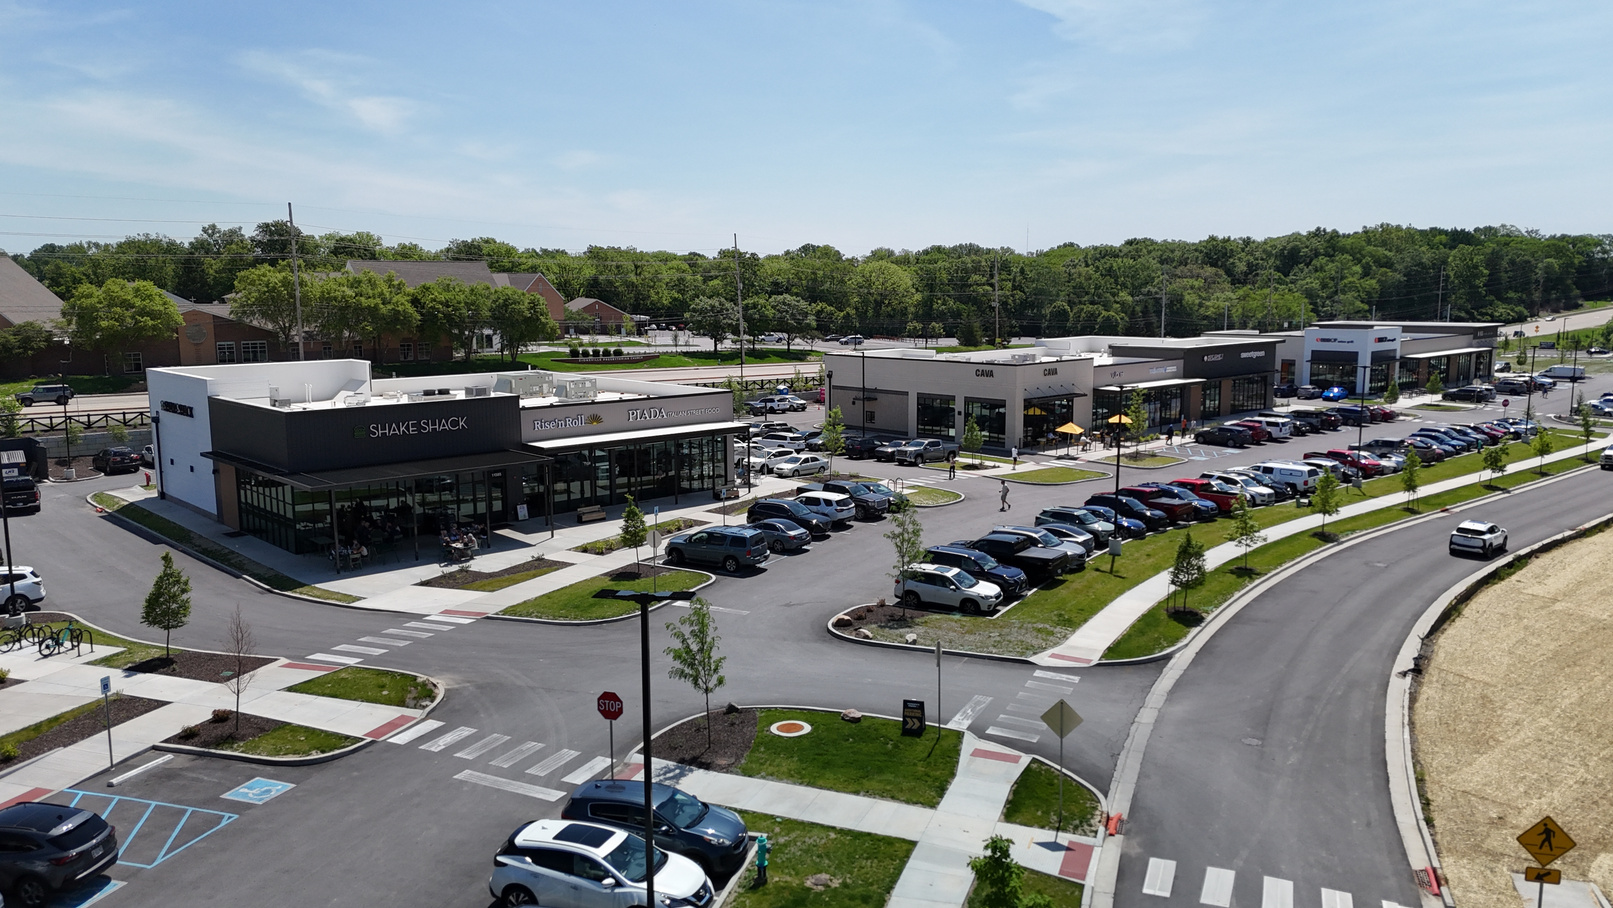
ZIONSVILLE, INDIANA
Where Business Takes Root.
An award-winning 56-acre mixed-use destination where retail, dining, residential living, and community come together.
56
Acre Master Plan
150,000 SF
Retail Space
75,000 SF
Professional Office
400
Multifamily Units
6
Residential Estates
THE LOCATION
At the center of it all.
Surrounded by a growing and affluent population, The Farm pairs high visibility, strong accessibility, and built-in residential density with a distinctive setting designed to attract leading brands and create a lasting destination.
- Bounded by Sycamore Street (116th St.) and N. Michigan Road (US-421)
- Minutes from I-465, I-65, and US-31
- Located at the intersection of Zionsville, Carmel, and Indianapolis
THE VISION
A 56-acre master plan.
A thoughtfully planned mix of retail, office, residential, and open space — connected by walkable streets, scenic trails, inviting gathering places, and natural landscapes to create a vibrant destination for the community.

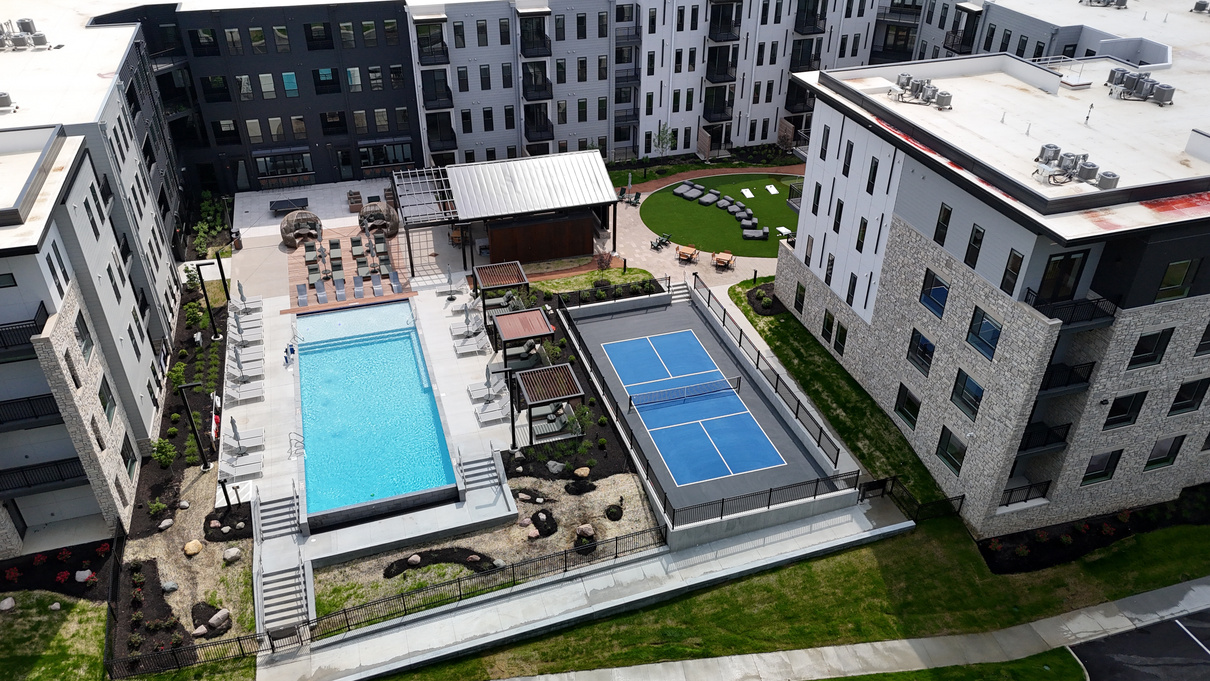
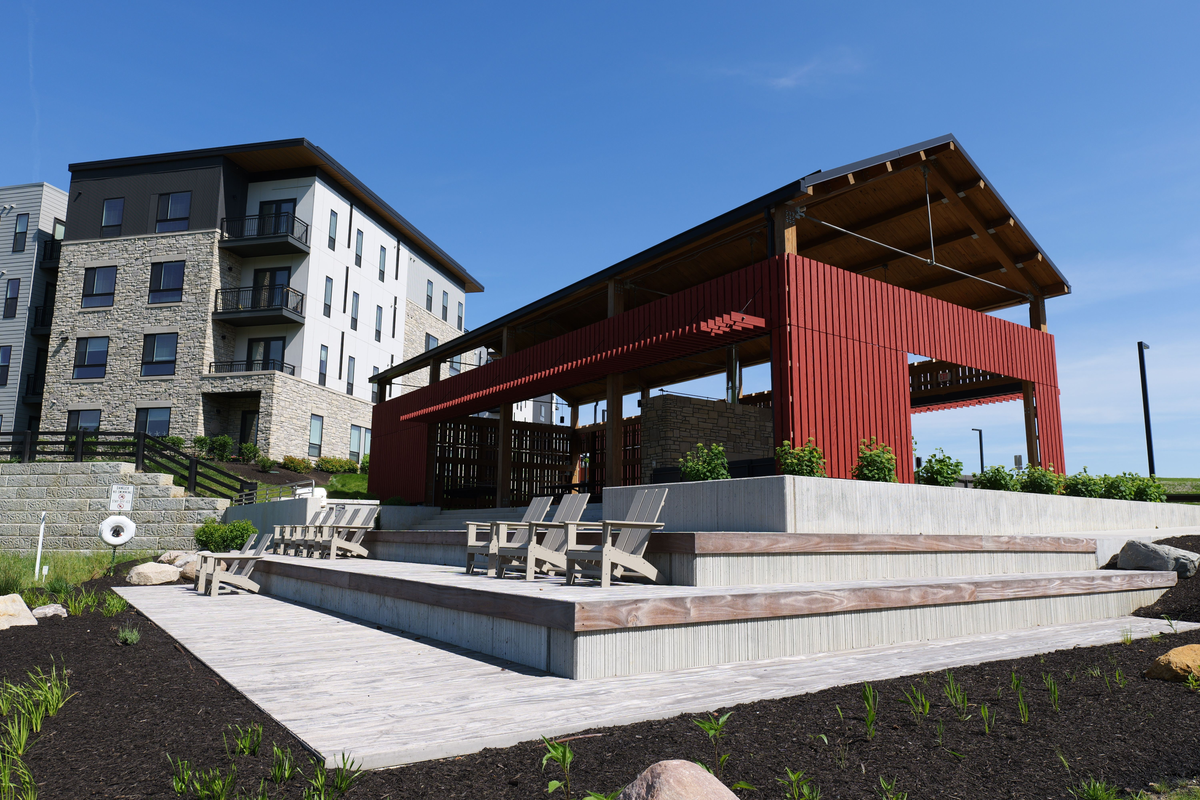
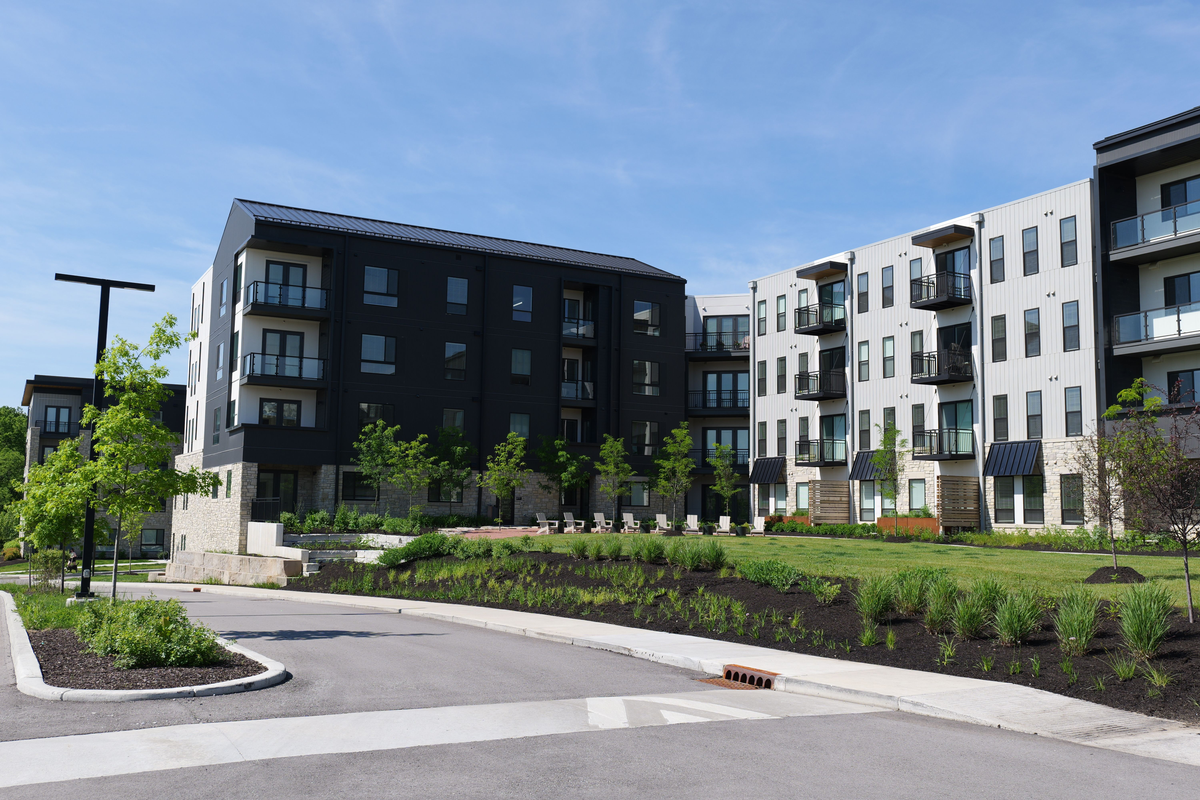
Structured Parking
A 400-stall garage keeps the streetscape walkable.
Preserved Woods & Creek
Mature woods and a creek corridor protected along the south edge.
Trail Network
Connected paths link every lot, commons, and gateway feature.
AVAILABLE NOW
Your spot is waiting.
Explore the site plan. Filter by status, select any space to see its details, and inquire directly with our leasing team. Scroll to zoom, drag to pan.
SIGNED LEASES
In good company.
National brands and local favorites have already put down roots at The Farm.
Food & Beverage
- CAVA
- Shake Shack
- Graeter's Ice Cream
- Torchy's Tacos
- Rise'n Roll Bakery
- Piada
- West Coast Sourdough
- sweetgreen
- BIBIBOP
- Niku Sushi.Bar.Kitchen
- Crafter's Pizza (Under Construction)
Wellness & Services
- Community Pet Health
- Macho's Barber Shop
- V/O Med Spa
- Prime IV
- Hollywood Nail Lounge
Grocer
- The Fresh Market (Under Construction)
Indiana's Premier Trade Area
The Farm sits in Zionsville, ranked #1 in median household income among Indiana cities and towns with 5,000 or more residents, based on U.S. Census Bureau data. Located within Boone County, Indiana’s fastest-growing county by population percentage in 2025, The Farm combines an affluent customer base with regional growth, creating a compelling setting for retail, dining, and everyday services.
$166,126
Median household income within 3 miles
$5.1B
Buying power within 5 miles
69.9%
College graduates within 3 miles
9.1%
5-year population growth within 1 mile
| Population | 1 Mile | 3 Miles | 5 Miles | 10 Miles | 10 Min. Drive |
|---|---|---|---|---|---|
| Population | 5,571 | 40,601 | 108,406 | 459,135 | 52,356 |
| 5 Yr Growth | 9.1% | 8.0% | 6.0% | 4.6% | 7.4% |
| Median Age | 41 | 42 | 40 | 38 | 41 |
| 5 Yr Forecast | 42 | 43 | 41 | 39 | 42 |
| Employment | 2,776 | 24,595 | 100,081 | 251,280 | 27,448 |
| Buying Power | $274.6M | $2.4B | $5.1B | $17.8B | $3.1B |
| 5 Yr Growth | 9.1% | 9.0% | 9.2% | 7.1% | 8.3% |
| College Graduates | 70.9% | 69.9% | 60.6% | 51.6% | 69.4% |
| Household | 1 Mile | 3 Miles | 5 Miles | 10 Miles | 10 Min. Drive |
| Households | 2,260 | 14,591 | 41,446 | 183,092 | 18,674 |
| 5 Yr Growth | 9.4% | 8.1% | 5.5% | 4.3% | 7.4% |
| Median Household Income | $121,502 | $166,126 | $124,104 | $97,039 | $165,814 |
| 5 Yr Forecast | $121,139 | $167,481 | $128,448 | $99,622 | $167,088 |
| Average Household Income | $166,361 | $185,077 | $158,132 | $128,330 | $187,168 |
| 5 Yr Forecast | $166,431 | $185,559 | $161,404 | $130,613 | $187,911 |
| % High Income (>$75K) | 72% | 77% | 68% | 60% | 80% |
Demographic snapshot: August 2026. Household income estimates: 2025.